The average post-event report opens with attendance, a satisfaction score and eleven photographs. None of those three tell you whether the event was worth running, and everybody in the room reading it knows.
Event ROI has a reputation for being hard to measure. It is not hard. It is uncomfortable, because measuring it with rigour means committing to a number before the event when you could instead choose a flattering one afterwards.
Here is the method.
Choose the metric before you design the event
This is the whole discipline and the rest follows from it.
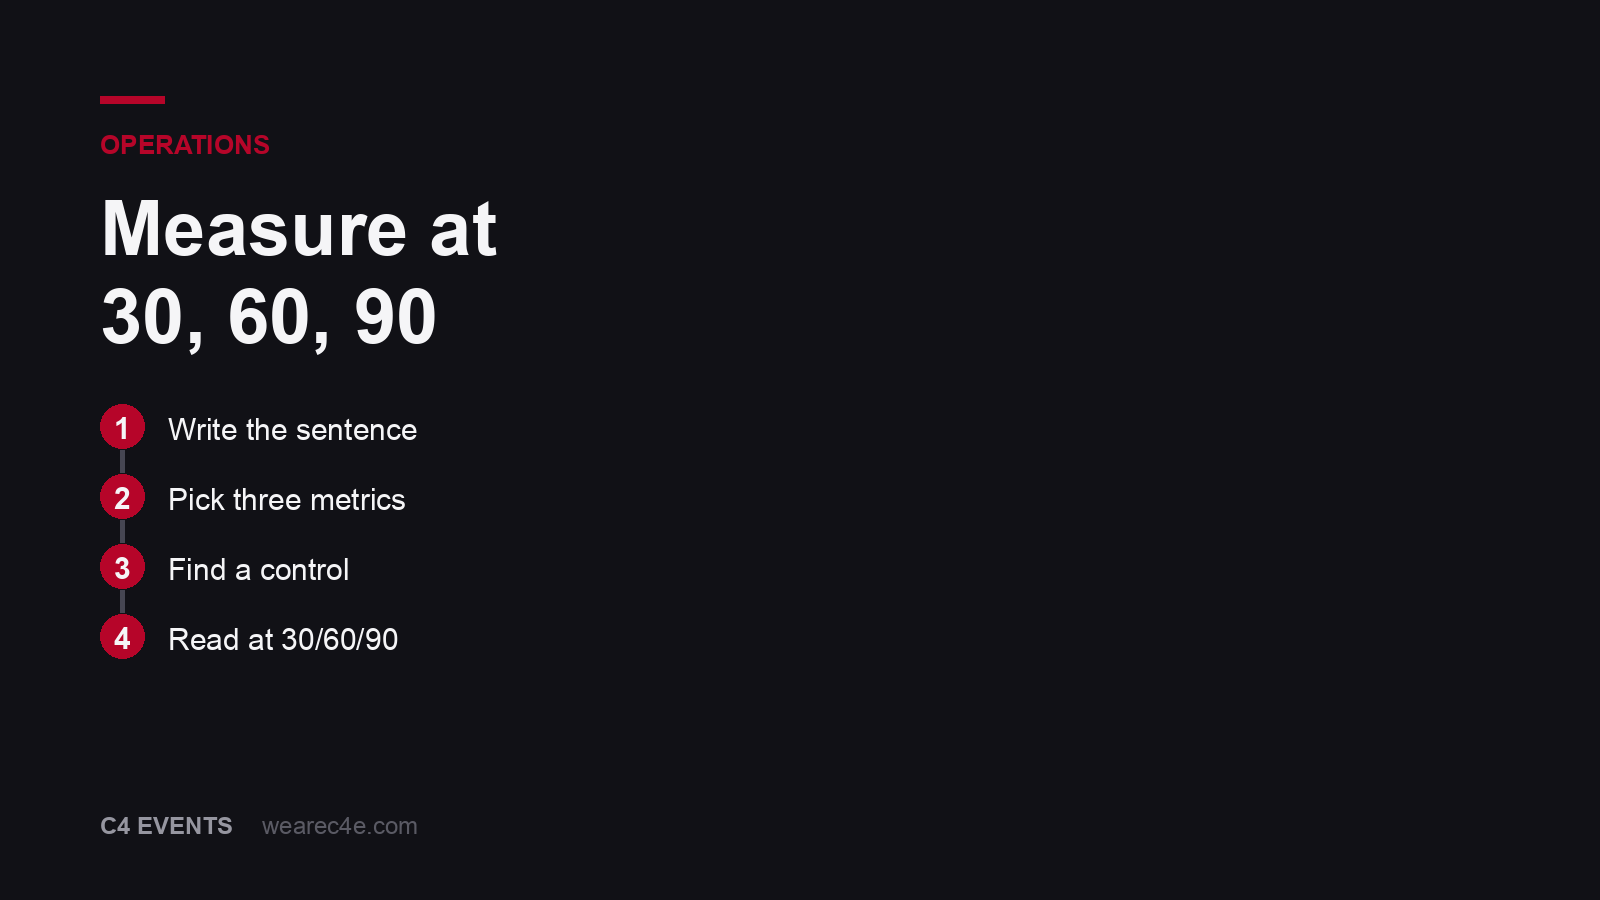
Before the venue, before the agenda, write one sentence: this event has worked if X changes by Y within Z days. Then pick three metrics that would show it, and check each against one test: is it already captured in a system we run, without anyone having to do extra work?
If a metric needs a new process to collect, it will not get collected. Use the CRM, the order book, the LMS, the HR system, the support queue. The data you already have is the data you will still have in 90 days.
Examples that work by format:
- Sales kickoff: pipeline created by attendees, adoption of the new messaging in call notes, ramp time for new hires who attended. See the kickoff guide.
- Dealer meet: order volume from attending dealers, uptake of the launched product, network attrition over two quarters. See what a dealer meet costs.
- Incentive trip: qualifier performance in the following two quarters, and how many people qualify next cycle.
- Conference: qualified conversations, meetings booked, opportunities created within 90 days.
- Internal offsite: retention of attendees against non-attendees, and completion of whatever the offsite committed to.
The control group, which almost nobody uses
Year-on-year comparison is the standard method and it is close to worthless, because the year changed as well as the event. A market moved, a competitor stumbled, a product shipped late, a currency slipped.
The fix is a control group: the comparable people who did not attend. Reps who could not travel. Dealers who declined. The region that skipped this cycle.
Compare attendees against that group over the same window and you have removed most of what was going to confuse you. It is not a randomised trial. The people who attend are not identical to the people who did not, and you should say so in the report. It is still an order of magnitude better than comparing this March to last March.
Where no natural control exists, use a staggered rollout: run the event for half the population, measure, then run it for the rest. This is more work and it produces the only defensible number in the category.
Read at 30, 60 and 90
One week measures enthusiasm, which fades. One year measures the year.
The 30-60-90 window is where an event’s own effect is visible. The shape of the curve tells you something the endpoint does not:
A spike at 30 that decays by 60 means the event motivated and did not equip. People left keen and had nothing new to do on Monday. The fix is more practice and less presentation.
Flat at 30, rising at 60 means the event taught something that took time to land. That is a good result and it looks like a failure if you only read the first checkpoint.
Flat throughout means the event did not change behaviour. That is worth knowing, and it is the finding most reports are designed to avoid producing.
For anything touching a long buying cycle, add a 180-day read.
Cost per what
Cost per attendee is the number everyone quotes and it rewards the wrong thing. Cut the food, add 50 people, and your cost per attendee improves while the event gets worse.
Better denominators, by format: cost per qualified conversation at an exhibition, cost per qualifier retained for an incentive programme, cost per attending dealer’s incremental order volume, cost per rep who hit quota.
None of these are clean. All of them point at the outcome rather than the headcount, which is the point.
What to do about the things you cannot measure
Some of what an event produces will not appear in any system. Relationships. A dealer who was on the way out and stayed. The conversation in a corridor that killed a bad project. A team that trusts each other more in November because of what happened in March.
Two honest moves here. First, do not pretend to measure them with a survey question about “connection”. A five-point scale on a feeling is not evidence and it weakens the credible parts of your report by association.
Second, capture them as narrative, named, and separate. Three specific things that happened, with names and dates, in their own section, labelled as anecdote. A senior reader will weigh three concrete stories on their merits and will discount a fabricated metric in full.
The report
One page, in this order.
1/ The objective, as written before the event. Copied, not rewritten. This is the part that keeps everyone honest.
2/ The three metrics, with attendee and control numbers at each read.
3/ Cost, and cost per outcome.
4/ What to change. Three things, specific enough to act on.
Photographs go in an appendix. They are for the internal audience and they are not the argument.
Our own bad habit
For years our wrap reports led with delivery: what was built, what was run, what went well. It made a strong case for us and a weak case for the client’s next budget request, because the person who has to defend the spend inside their own company cannot walk into a finance meeting with a production summary.
We now agree the three metrics with the client before we design anything, and the wrap report opens with them whether they moved or not. It has produced two conversations where the honest answer was that the event did not shift the number. Both of those clients are still with us, and both events changed shape the following year.
Reporting the miss is what makes the hits credible.
The three numbers a finance director will ask for
Whoever signs the budget will ask three things, and a report that answers them upfront gets a different reception from one that has to be interrogated.
What did it cost, all in? Including internal time, travel for your own people, and the tail of reconciliation. A number that counts only the invoice is a number that will be corrected in the meeting.
What moved? The metrics you chose, against the control group, at the read points. With the flat ones shown as flat.
What would you do with the same money next time? This is the question that decides next year’s budget, and the honest answer is often “the same event, two weeks earlier” or “this event for half the people and a second one for the rest”. Have the answer ready.
Attribution, and how far to push it
There is a limit to how much an event can claim, and claiming past it damages the credible part of the case.
An event that took place in March cannot claim a deal that closed in April on a cycle that started the previous November. What it can claim is acceleration: the deal moved faster, the person who was blocking it attended, the conversation restarted. Say that instead, and say it in those terms.
The strongest reports in this category under-claim on purpose. They present the control-group comparison, name what the event cannot explain, and let the reader draw the conclusion. That reads as rigour, and rigour is what buys the next budget.
Who owns the number
One name, on the client side, agreed before the event. Not the events team, because they will be judged by it and should not also be the ones reporting it. The person who owns the business outcome: the sales director for a kickoff, the channel head for a dealer meet, the CMO for a customer conference.
That person pulls the data, because they already have access to it and because a number produced by the people who ran the event carries less weight than the same number produced by the people who asked for it.
When the honest answer is no
Some events do not work, and the measurement will say so. What happens next decides whether the measurement was worth doing.
The temptation is to reframe: find a metric that moved, lead with attendance, put the photographs first. That buys one budget cycle and costs the credibility of every report after it, because the person reading learns that your reports are advocacy.
The better move is to report the flat result, name the most likely cause, and propose the change. An event that did not shift the number and produced a clear diagnosis is more useful than an event that shifted the number for reasons nobody understood.
Three rules
1/ Write the success sentence before the venue. If you cannot write it, you are not ready to book anything.
2/ Find a control group. Non-attendees over the same window beat last year over a different one.
3/ Read at 30, 60 and 90. And publish the flat result when it is flat.
We build this into the programmes we run, because a client who can prove the event worked is a client who runs it again.
Tell us what the event has to change and we will help you write the sentence first.
And that, ladies and gents, is the measurement. What would you add?
Frequently asked questions
How do you measure the ROI of a corporate event?
Choose the behaviour you want changed before the event, define how it is visible in a system you already have, and read it at 30, 60 and 90 days against a comparable group that did not attend. Everything else is either a proxy or a feeling.
Why are event satisfaction surveys a poor measure?
Because they are collected in the room, from people who have been fed and entertained, about an experience rather than an outcome. A survey handed out while people wait for transfers measures the catering and the weather. It tells you whether people enjoyed themselves, which is worth knowing and is not ROI.
What is a control group for an event?
The comparable people who did not attend. Reps who could not travel, dealers who declined, the region that skipped this cycle. Comparing attendees to non-attendees over the same period removes the market conditions that make year-on-year comparisons meaningless.
When should event results be measured?
At 30, 60 and 90 days, and again at 180 for anything that changes a buying cycle. Measuring at one week captures enthusiasm. Measuring at one year captures everything that happened in the year. The 30-60-90 window is where the event’s own effect is visible.
What should an event report include?
The objective as written before the event, the three metrics chosen to test it, the attendee and control numbers at each read point, the cost per attendee, and one page on what to change next time. If the report leads with attendance and photographs, it is a scrapbook.